Diagram overview
Diagrams are visual views of your architecture model. They help teams explore structure, tell a story, and collaborate around a specific question.
A good diagram has a clear purpose. For example:
- Map the applications that support a business capability.
- Explain a data flow between systems.
- Show a target landscape for a transformation program.
- Capture workshop ideas before approving them into the shared repository.
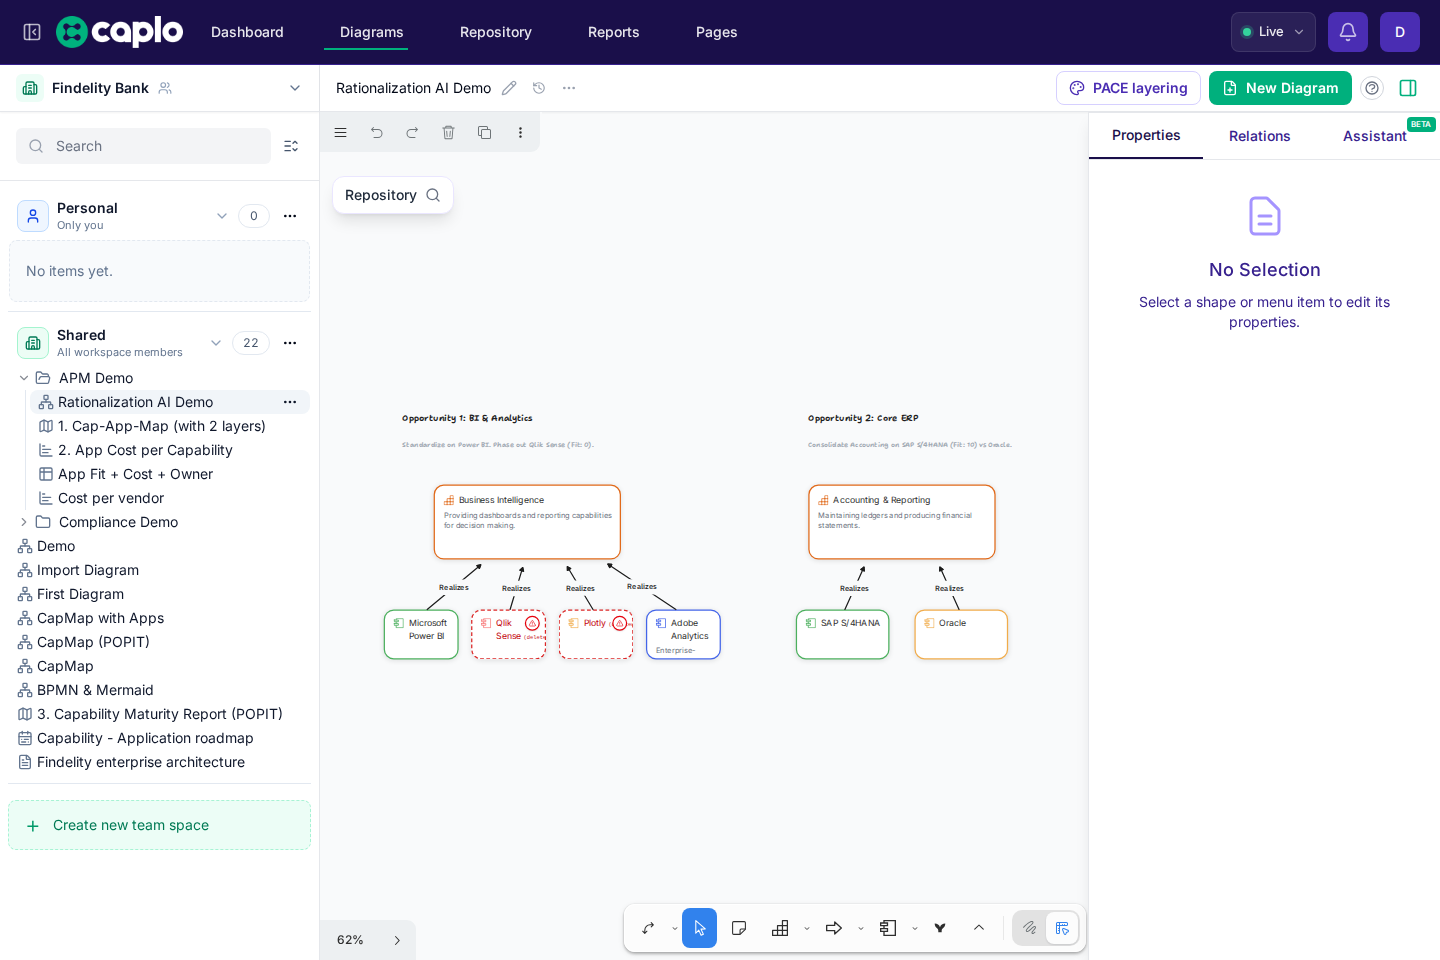
Repository-linked shapes
When a shape represents a reusable architecture object, link it to a repository entity. This lets the same entity appear on many diagrams without becoming separate records.
Linked shapes stay connected to the shared model. Their names, properties, relations, report usage, and other diagrams all refer back to the same repository item.
You can see a diagram in lists even when you cannot open it. Opening a diagram is blocked if any required linked entity or relation is hidden from you. Caplo explains the missing categories and counts; it does not show the forbidden names unless you can manage access.
If something only matters on one diagram, keep it freeform instead. Use draw-mode shapes, labels, and arrows for explanation, framing, or workshop notes that should not become reusable repository data.
Diagram references
When you select a repository-linked entity shape, the right panel shows Diagram references. This section lists every place where the same entity appears in live diagrams, including normal architecture shapes, BPMN shapes, and Mermaid shapes. Deleted diagrams are not listed.
Each reference has an icon that shows where the entity was found:
- The entity type icon means the entity is linked through a normal architecture shape, such as an Application, Process, Capability, or Data object.
- A BPMN icon means the entity is linked through a BPMN diagram shape.
- A Mermaid icon means the entity is referenced from a Mermaid diagram shape.
Click a reference to open that diagram and focus the relevant shape. You can also right-click a selected entity shape on the canvas and use Diagram references from the context menu for the same cross-diagram navigation. On an entity detail page, the Diagrams tab lists the same usages with a shape type column so you can see whether each row comes from a normal entity shape, BPMN, or Mermaid.
Arrows and relations
The arrow tool in the bottom toolbar draws either a curved arc or an orthogonal elbow. Open the chevron beside it to switch; Caplo remembers that choice for the next arrows you draw.
When both ends of an arrow are linked to repository entities, Caplo can create or reuse the matching reusable relation for you. Name a shape so it links to an entity before you connect an arrow or nest it. While you draw or drag an arrow, the canvas explains why at each endpoint that overlaps an unnamed shape. Releasing a new arrow in that state removes it.
That is why relation-aware arrows matter: they do not just decorate the canvas, they update shared architecture structure.
A linked BPMN shape follows the same rule as a normal Process shape. It is still the same Process entity, so you can use it in relation-aware arrow drawing the same way. The BPMN shape is simply the BPMN representation of that Process.
Draw mode and Architect mode
Caplo supports two modeling styles:
- Draw mode keeps the canvas lightweight for sketching, annotation, and early thinking.
- Architect mode focuses on architecture shapes, entity linking, reusable relations, and repository reuse.
Switch modes based on the work you are doing. Early workshops may start in Draw mode and move into Architect mode once the team agrees on reusable entities.
PACE layering
Use PACE layering in the diagram header, next to New Diagram, to recolor linked architecture shapes without changing the drawing or the repository. Turning it on opens one canvas panel. The source menu defaults to As-is / to-be. Capability fitness (POPIT) is the next option, then a field for static PACE. Click PACE layering again, or Clear in the panel, to turn it off.
- As-is / to-be colors shapes from Phase in / Phase out versus a from-today slider. The panel shows a legend and that slider.
- Capability fitness (POPIT) colors capability shapes by their overall People, Process, Technology, and Information assessment and shows that assessment on the shape. The panel shows a fitness legend. Other shapes keep their normal colors.
- A field applies the same static PACE coloring used in landscape reports to a property on linked entities. Expand Colors to set per-value colors or numeric ranges. TIME classification starts with Invest in green, Tolerate in purple, Migrate in orange, and Eliminate in red. Shapes without that field stay unchanged.
These modes are session presentation only. Only one source is active at a time. Capability fitness stays hidden until that source is selected.
As-is / to-be
As-is / to-be is the remaining-change coloring mode. It does not change the drawing or the repository.
Turn it on from PACE layering. The canvas panel opens with As-is / to-be selected and shows a legend and a from-today slider. Show 'Gone' (on by default) keeps already-gone shapes grey; turn it off to hide those shapes and the arrows connected to them.
- The legend shows AS-IS (white fill, original border and text), TO-BE - Arriving (green), TO-BE Leaving (red), and Gone (grey).
- The right end of the bar is the day after the latest remaining Phase in / Phase out date on this diagram. That extra day lets you move past a Phase out so those items become gone.
- Drag the thumb to choose an as-of date from today forward. Colors compare that date with the locked to-be date.
- Click Today to jump the thumb back to today and see the full remaining plan.
- Green bands on the track mark Phase in windows. Red bands mark Phase out windows. An exact day is a single tick instead of a band.
Linked architecture shapes and relation arrows recolor from each entity's Phase in and Phase out fields:
- AS-IS is live at the as-of date and still remaining after the to-be date.
- TO-BE - Arriving is not yet live at the as-of date. That includes a future Phase in range, even when that window is the locked to-be date.
- TO-BE Leaving is live at the as-of date, but gone after the to-be date. That includes a Phase out on the to-be date itself, whether it is an exact day or a year / quarter / month.
- Gone items are already retired by the as-of date.
Drag the thumb forward to see what change is still remaining after that date. An arrival stays green until the as-of date reaches it, then it reads as AS-IS. A retirement stays red until you pass it, then it is gone.
Decorative shapes, unlinked architecture shapes, Mermaid, and BPMN cards keep their normal colors. Deleted and unapproved chrome still wins over this overlay. Capability fitness coloring is a separate source in the same menu.
Phase in and Phase out
Every entity type has built-in Phase in and Phase out fields. Set them on the entity in the repository or in the right-hand properties panel. You can pick an exact day, or a calendar period (year, quarter, or month).
When no date is set
- Empty Phase in means the item is already active. As-is / to-be reads it as AS-IS.
- Empty Phase out means there is no planned retirement. It stays in the picture as you move the slider into the future.
If nothing on the diagram has phase dates after today, currently live items stay AS-IS. Already-retired items are gone (grey).
Exact day vs a date range
Use an exact day when you know the switch happens on a specific date, such as 15 March 2027.
Use a year, quarter, or month when you only know the period, not the day. For example, a phase-out of Q2 2027 means retirement can happen anytime in that quarter. As-is / to-be treats the whole period as live, the same way landscape and bar-chart sliders do. On the diagram, the fill eases across that window: green toward white while arriving, and red to grey while leaving. AS-IS only changes the fill to white; border and text stay as drawn.
Panels
Writable diagrams show a Repository chip on the left of the canvas. Click it to search and drag approved repository entities onto the diagram. The right properties panel still opens and closes from the page header.
Typical flow:
- Open the Repository overlay to find and drag repository entities onto the canvas.
- Select a shape or relation on the canvas.
- Use the right panel to inspect or edit its properties and relations.
History
Open History in the diagram header to browse past canvas versions. View opens a read-only preview. Restore writes that canvas back onto the live diagram, or onto the draft you are working in. The ... menu after History deletes the diagram; you can restore it from History or Dashboard Latest actions.
Canvas versions are saved about every 90 seconds while you edit. Rename, folder, and privacy changes do not get their own History rows.
History and snapshots also covers restore and workspace snapshots.
Collaboration
Diagrams are designed for team work. Multiple people can work from the same shared diagram. Use a Personal diagram for private exploration. Use a draft to try canvas changes without updating the live workspace.
Keyboard shortcuts
Useful Diagram shortcuts and controls:
- Undo:
Ctrl+Zon Windows/Linux orCmd+Zon macOS. - Redo:
Ctrl+Shift+Zon Windows/Linux orCmd+Shift+Zon macOS. - Pan the canvas: drag with the scroll wheel, or hold
Spacewhile dragging. - Zoom: hold
Ctrlwhile scrolling.