Landscape reports
A landscape report shows nested groups of related entities. For example:
- Business capability > application.
- Capability > application > data object.
- Value stream > process > application.
- Vendor > application > capability.
Choose a root layer, then add one or more connected layers. Caplo follows repository relations to place matching entities in the report.
Use landscape reports when the shape of the architecture matters more than a total or ranking. If you need totals or comparisons, use bar charts.
Building layers
Pick a root layer that matches the viewpoint you want to organize around, then add one or more connected child layers. Each non-root layer defines both the entity type and the direction from its parent.
Landscape reports use the shared relation-path, direction, and hop-count model described in Reports overview. The landscape-specific part is the nested structure: every added layer becomes another level in the map.
Each layer also has an Auto nest children option. When enabled, Caplo follows downstream Child of relations from that layer and renders those descendants as extra nested cards before the next configured layer. This helps when the hierarchy is meaningful, but you do not want to model every intermediate level as a separate configured layer.
If a custom report feels empty or wrong, the usual cause is relation direction, path choice, or filters rather than the chart itself. Start with one clear question and a small slice of data, then save a shared report once the path behaves the way you expect. Use the graph preview functionality in the Relations tab to investigate how entities are interconnected.
PACE coloring and legends
Landscape reports can color items by a selected field, such as TIME classification or lifecycle stage. Use coloring to highlight decisions, not decoration.
Choosing TIME classification starts with semantic colors: Invest is green, Tolerate is purple, Migrate is orange, and Eliminate is red. You can still edit those colors afterward.
Each configured layer can have its own PACE coloring field and color map. This means you can color capability cards by one field and application cards by another field in the same report.
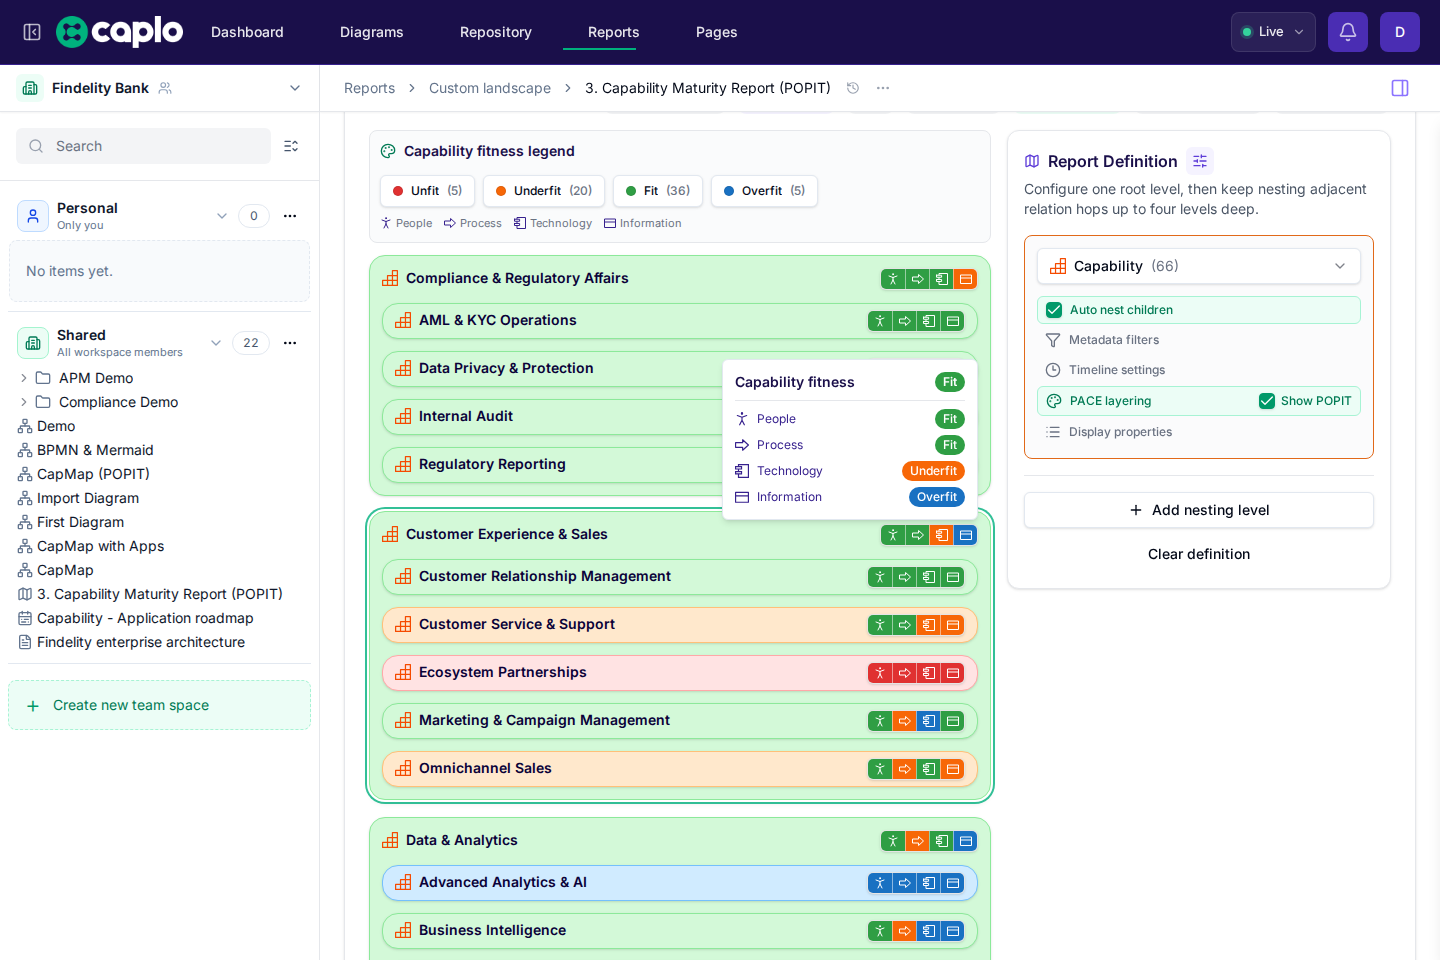
On capability layers, PACE layering also offers Capability fitness (POPIT) as an alternative to metadata-based coloring. That mode uses Caplo's built-in maturity properties instead of a custom field map; see Capability maturity display.
PACE layering can also use As-is / to-be. That mode colors the layer from Phase in / Phase out versus a from-today slider: remaining AS-IS (white fill, original type border and text), arriving (green), leaving (red), and gone (grey). Arriving items stay on the map. Show 'Gone' (on by default) keeps already-gone items visible and grey; turn it off to hide those items. As-is / to-be, a metadata field, and capability fitness cannot be active on the same layer at once.
The built-in As-is / to-be landscape report is a capability-to-application landscape with this coloring already on. Open it from Reports when you want remaining-change colors without configuring PACE yourself. If no Phase in or Phase out dates are set on applications, the slider shows No remaining-change dates and explains that you need those fields on the colored layer before arriving, remaining AS-IS, leaving, and gone can be compared.
A good legend should make the report easier to interpret at a glance. Click a legend option to filter that layer to the matching values. Click it again to remove that value. Discrete fields keep multiple selected values; numeric ranges replace the current range filter. Selected options stay pressed. The other options stay visible so you can turn more than one on. Counts stay visible on every option, including ones that are not selected, so you can see how many current entities have each value before adding another filter. Counts on a lower layer still respect filters set on layers above it.
On capability layers, metadata filters also include Capability fitness (POPIT). That option uses the same overall Unfit / Underfit / Fit / Overfit result as PACE coloring, so you can filter the landscape to one or more fitness levels even when coloring is off. Clicking a fitness legend option applies the same filter. When more than one layer uses fitness coloring, the shared legend turns that value on or off for all of them. Fitness legend options show the current entity count in parentheses, like PACE chips. Those counts also stay visible on options that are not selected.
Capability maturity display
On capability layers, choose Capability fitness (POPIT) from the PACE layering color-by menu to color cards by overall fitness from Caplo's built-in People, Process, Technology, and Information assessments. Caplo averages those four scores into Unfit, Underfit, Fit, or Overfit once all four are set.
Enable Show POPIT to keep the four-dimension indicator visible, or leave it off to show it only on hover. Capability fitness and metadata-based PACE coloring cannot be active on the same layer at once.
For the full assess-then-report workflow, see Capability maturity mapping.
Display properties
Each layer can show up to three entity properties under the card or chip name. Pick any supported field (text, numbers, currency, selects, dates, user fields, and similar), then choose how it appears:
- Text shows the property name and formatted value. User fields show the person's name, or "Unknown user" when that profile is not visible in the workspace.
- Bar is available for number, currency, and slider fields. Caplo draws a horizontal bar scaled to the largest value currently shown on that layer, with the property name and formatted value above the bar.
Display properties work alongside PACE coloring and capability maturity. They do not replace them.
Timeline sliders
Timeline sliders filter report results based on date fields, including built-in phase-in and phase-out. This is useful for showing what is active today, what appears in a future roadmap, or what disappears after a retirement date.
A landscape report has one active timeline slider at a time. Choose the layer whose date fields should drive the slider, then configure the Appear and Disappear fields for that layer. When those fields are a year, quarter, or month, the slider treats the whole period as possible-active rather than waiting until the last day. The slider extends one day past the latest phase-out so you can move past that inclusive retirement date.
When a layer uses As-is / to-be coloring, that slider becomes the remaining-change control instead: it colors cards rather than hiding everything that is not possible-active. Turn Show 'Gone' off to drop already-gone items only. Timeline settings is grayed out while As-is / to-be is on, because that mode owns the slider. Static PACE plus the filter-style timeline stay available when As-is / to-be is not selected.
Saving landscape reports
Save a landscape report when it answers a recurring question. Shared reports should have clear names and stable filters so teammates can trust them.